Enter your email address to download and customize presentations for free
Need an informative yet concise way to convey six months of performance, progress, and priority shifts to stakeholders? Our Half-Year Report spotlights the inflection points that matter the most to an organization's trajectory with essential sections to cover key developments and strategic updates. When done right, the half-year report helps to strengthen investor confidence, aligns internal momentum, and signals market readiness.
Download free weekly presentations
Enter your email address to download and customize presentations for free
Not for commercial use
Download 'Half Year Report' presentation — 27 slides
+39 more presentations per quarter
that's $3 per presentation
/ Quarterly
Commercial use allowed. View other plans


Need an informative yet concise way to convey six months of performance, progress, and priority shifts to stakeholders? A well-crafted interim report doesn't simply recount – it spotlights the inflection points that matter the most to the organization's trajectory. Our Half Year Report presentation guides that process through its essential sections: Corporate Overview, Strategy Developments, Financial Performance, Operational Updates, Other Key Developments, Outlooks, and an Appendix of Condensed Financial Statements. When done right, the half-year report helps to strengthen investor confidence, aligns internal momentum, and signals market readiness.
An effective half-year report generates impact beyond the boardroom. It enhances capital efficiency as investments are anchored to visible results, fortifies enterprise trust by linking execution to vision, and sharpens competitive positioning by clarifying where the company leads and where it's going next.
Download free weekly presentations
Enter your email address to download and customize presentations for free
Not for commercial use
Download 'Half Year Report' presentation — 27 slides
+39 more presentations per quarter
that's $3 per presentation
/ Quarterly
Commercial use allowed. View other plans
An update on strategic pillars provides a crucial snapshot of progress across the company's core priorities. Each pillar represents a foundational lever for sustained value creation. By tying specific initiatives to these pillars, leadership not only summarizes what happened, but also codifies how progress is being built into the company's operating DNA.
When discussing growth strategies specifically, McKinsey's Three Horizons model can be used as a practical filter for capital allocation and growth logic. The framework encourages the organization to differentiate between core execution, near-term acceleration, and longer-horizon bets – each with distinct risk profiles, returns, and strategic implications. This is particularly useful in the context of AI-forward companies, where the lines between horizon categories can blur. By mapping revenue contribution and investment allocation across these horizons, the framework helps rationalize resource deployment and surfaces the company's true strategic posture. Is it playing it safe with mature bets, or shaping the edge with asymmetric upside?
Competitive benchmarking and macroenvironmental scans shift the lens from internal accomplishments to external positioning. While internal metrics show execution, benchmarking reveals competitiveness. Here, the triangular radar chart illustrates how the company stacks up on three core levers of enterprise health. Surrounding the benchmarking are contextual forces – market headwinds and tailwinds – that act as both backdrop and stress test.
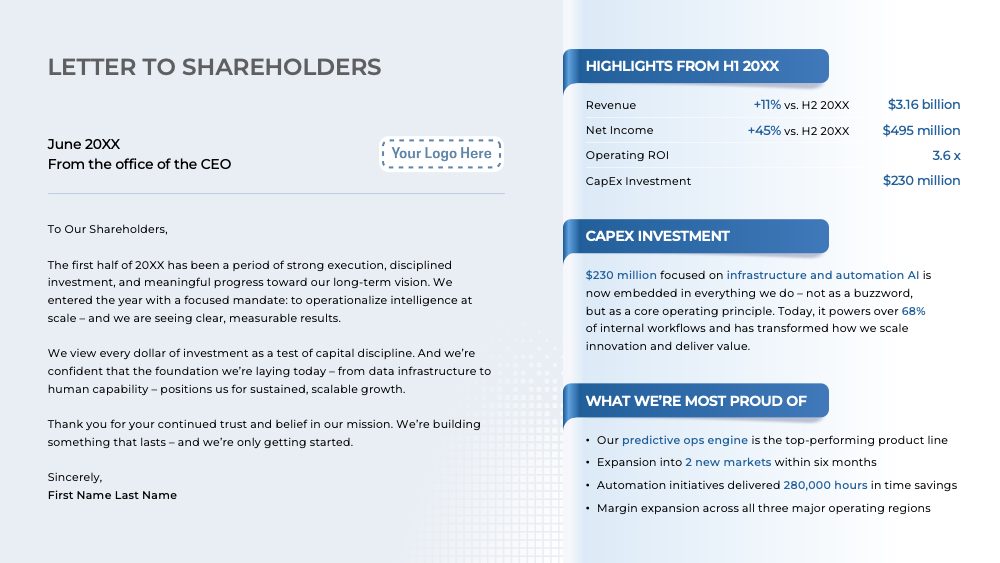
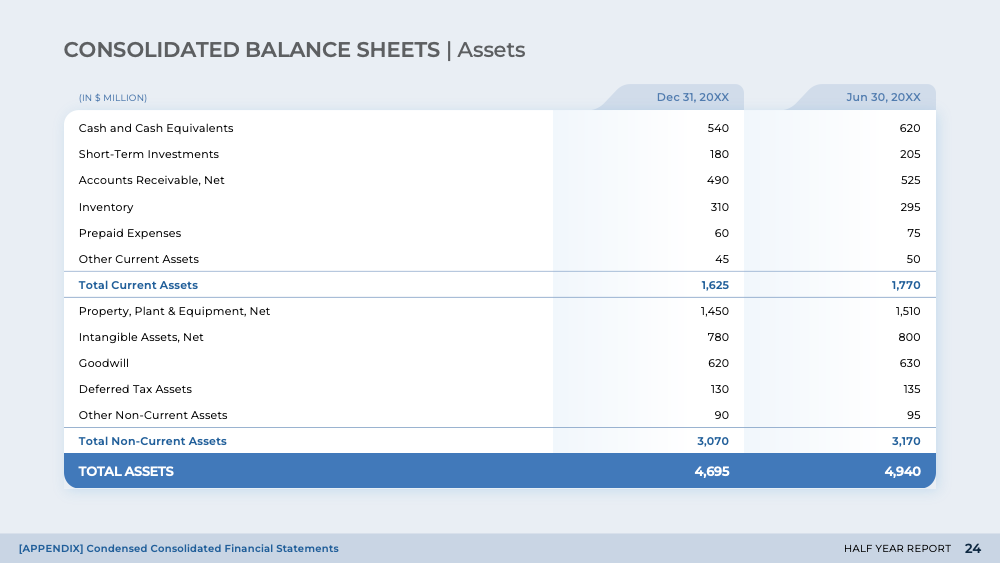
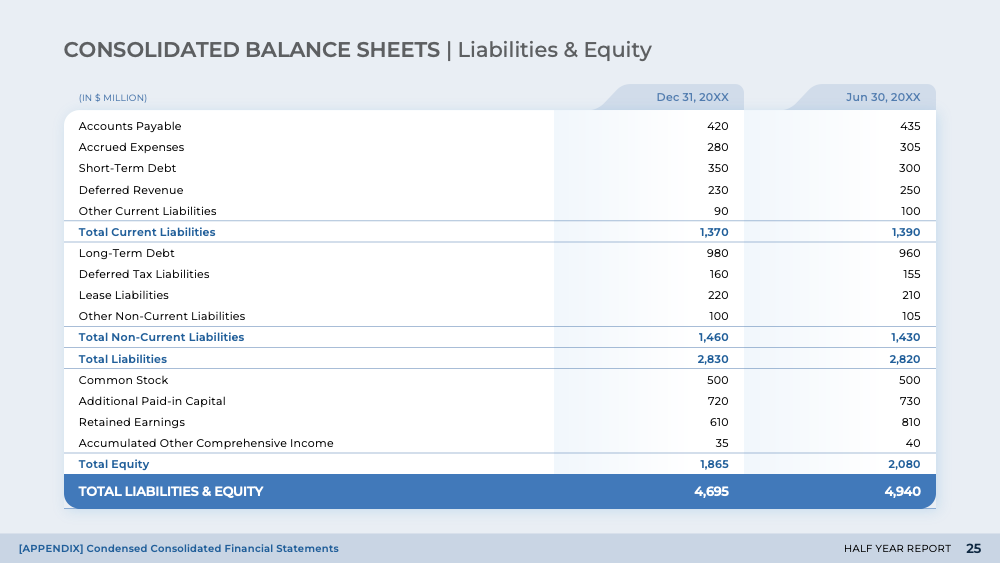
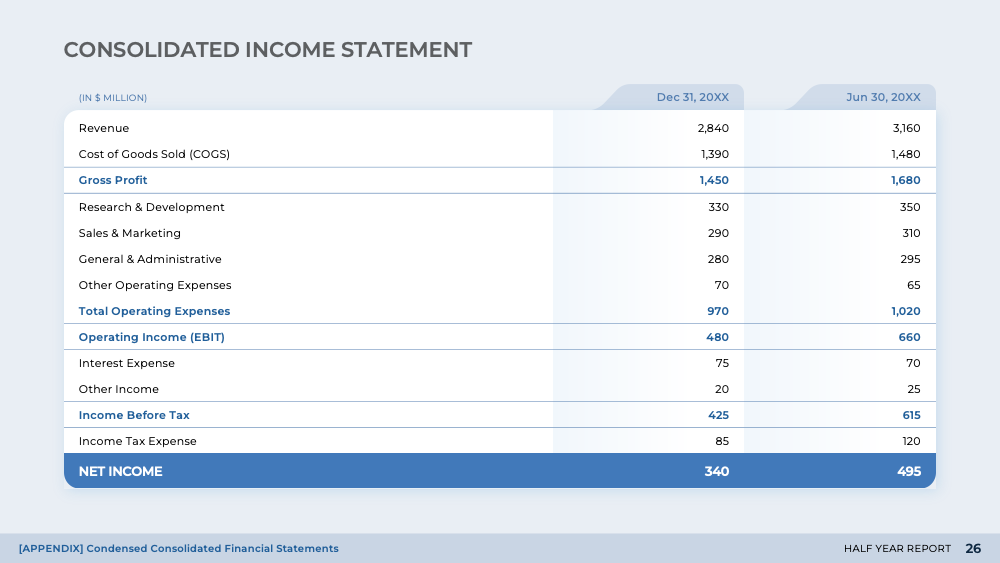
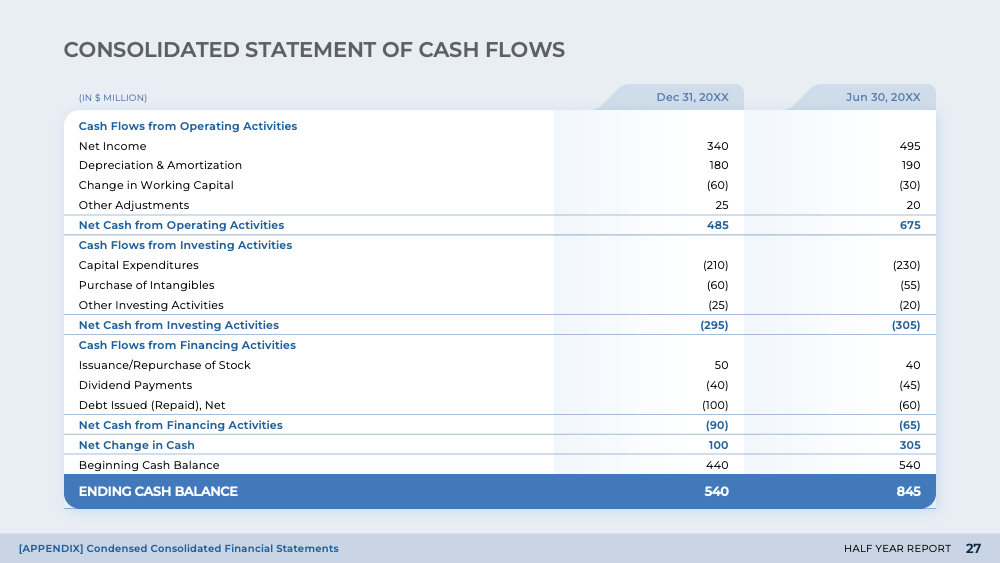
The Financial Highlights summary acts as both a reality check and a performance pulse. While much of a Half-Year Report explores strategy and momentum, this content squarely answers: did it work? This overview isn't just a retrospective scoreboard. It offers clear talking points for investor briefings, internal reviews, and board discussions.
Discussions on shareholder value and EPS sharpen the focus on one of the most digestible but high-stakes metrics in financial communication. What makes this display particularly valuable is its framing of EPS not as an isolated data point, but as the outcome of years of compounded margin discipline and strategic execution. The inclusion of EBIT and net margins in parallel, for example, helps explain why EPS is rising. For investor-facing audiences, this linkage between operational performance and earnings consistency can strengthen confidence in the company's underlying fundamentals.
Capital allocation rarely gets the storytelling focus it deserves. Rather than treating CapEx as an opaque spend line, consider framing it as a deliberate portfolio of bets tied to concrete value creation. This structure can be used as a template to guide CapEx conversations going forward, helping leadership justify investments not just on technical merit, but based on strategic alignment and ROI discipline. And for investor conversations, explicitly linking capital outflows to long-term value creation creates a compelling case for trust in management's judgment.
The segment financials view disaggregates performance into regional contributors. It provides critical visibility into where the engine is pulling hardest and where it needs tuning. Especially for companies expanding globally or scaling across diverse markets, this level of granularity contextualizes aggregate metrics by showing which geographies are delivering margin improvement, scale effects, or operational breakthroughs, or which still carry drag.
Download free weekly presentations
Enter your email address to download and customize presentations for free
Not for commercial use
Download 'Half Year Report' presentation — 27 slides
+39 more presentations per quarter
that's $3 per presentation
/ Quarterly
Commercial use allowed. View other plans
Within the broader context of the operational updates section, the OPEX Structure and Main Cost Drivers view reframes cost not as a liability, but as a strategic decision set. It gives stakeholders visibility into where operating expenses are concentrated, and more importantly, why. Rather than treat spend categories as static line items, this view introduces the concept of "strategic purpose" for each cost driver. This enables the conversation to shift from expense management to investment logic.
The Operational Efficiency matrix advances the conversation by turning cost inputs into measurable productivity and margin outcomes. It creates accountability around OPEX performance: not just how much is being spent, but how effectively it converts to enterprise value. On the strategic level, this layout also empowers discussions around prioritization: where to double down and where to press pause.
Assessment of output and returns offers a culmination of operational insights by consolidating the most outcome-driven indicators, such as efficiency ratio, return on OPEX, and productivity index. These metrics serve as proxies for the health of internal systems and the organization's ability to translate processes into profit. The inclusion of both absolute levels and directional change across time periods allows for a narrative of progression, not just position. In management conversations, these indicators can support budget reallocation decisions or greenlight new internal initiatives. In investor settings, they reinforce the message that this is not growth at any cost, but rather growth governed by precision, adaptability, and leverage.
Product updates move the narrative from financial metrics to the frontlines of innovation and customer engagement. Rather than just highlighting topline figures, this content reinforces how product performance ties directly into broader value creation. The R&D pipeline tracker along the bottom is especially useful to signal future momentum. It allows stakeholders to see that product expansion is not opportunistic but sequenced
In the context of commercial traction, GTM footprint and activities bring visibility into how distribution strategy supports product success. The content illustrates the tactical side of expansion and ties it directly to results in market share and average deal size across geographies. This structure is particularly useful for linking operational choices to quantifiable commercial outcomes.
Updates on organizational governance add depth to the operating model. It points to how structural and leadership changes enable execution. By presenting governance transformation in terms of creation, consolidation, and elimination, it positions reorganization as a deliberate act of strategic refinement. This framing moves the conversation beyond mere org chart shuffling and anchors it in outcomes.
The AI Adoption Progress dashboard brings precision to what is often an overgeneralized subject. Instead of loosely claiming momentum in AI, this layout breaks adoption into quantifiable components: use case coverage, ROI estimates, skill penetration, and capability maturity. This matters because it transforms the perception of AI from a tech layer to a capability infrastructure. Mapping each use case by penetration and payoff allows leadership to allocate resources and sponsorship based on value, not novelty.
A full-year guidance translates half-year performance into full-year expectations. Unlike a generic forecast, this view builds discipline into the projection process by grounding every metric in clear, bounded assumptions. The inclusion of operational caveats adds a layer of transparency often missing in standard guidance slides. In an environment where macro volatility can cloud judgment, explicitly stating what conditions forecasts are contingent on strengthens trust in leadership's planning credibility.
Last but not least, share a roadmap for upcoming initiatives and how they play into long-term value creation for the second half-year and beyond. It elevates planning from abstract themes to concrete bets, each backed by an input-output logic chain. This is especially useful for aligning executive teams and boards around where long-term value will be created and how.
A well-designed Half Year Report should transform mid-year into a strategic checkpoint rather than a passive milestone. It draws a line from strategy to execution, from performance to accountability, and from capital allocation to long-term value creation. When used with intention, it becomes a shared reference point across the organization to enable sharper decisions, synchronized momentum, and credibility in the eyes of the market.
Download free weekly presentations
Enter your email address to download and customize presentations for free
Not for commercial use
Download 'Half Year Report' presentation — 27 slides
+39 more presentations per quarter
that's $3 per presentation
/ Quarterly
Commercial use allowed. View other plans

Need a way to communicate periodic updates with stakeholders and team members? With sections that traverse essential areas of most businesses, our Quarterly Report presentation lays out insights from financial performance, market and industry trends, product and innovation updates, operations and supply chain, sales and marketing performance, organizational updates, strategic initiatives, risks and challenges, and future outlook. Use these slides to simplify complex reporting, set a solid foundation for strategic conversations, and make proactive adjustments for long-term planning.

Do you find it hard to appease investors? Our Investor Report presentation provides the most important talking points in front of board members and stakeholders and allows the investor relations team to highlight recent wins and secure future support.

Need to showcase the year's achievements? Our Annual Report collection provides customizable slides that can be used for any business need. It includes slides for growth and market share, product portfolio, revenue breakdown, sales summary, income versus expenses, sustainability highlights, and many more.

Need to report your sustainability efforts to key stakeholders? Most companies make ESG reports public, and public companies may soon be required by law to provide them by the SEC. Download our Sustainability Report presentation template to easily highlight the core goals, actions and implementation of your ESG efforts.